Grocery AI
Companies are inserting AI features everywhere you can imagine. However, I have not seen any AI features on the consumer side of grocery shopping. I thought it would be interesting to explore that vacuum. So, I started my own independent research study to understand what the potential is for AI in the average person’s grocery shopping experience.
The purpose of the study is to fill 4 knowledge gaps:
What sort of pain points people experience in their current grocery/food shopping experience?
What sorts of needs are not being met in their current grocery/food shopping experience?
Where are people already using AI assisted services in other areas of their lives?
What are the possible opportunity areas to create AI enabled services that would improve their grocery/food shopping experience?
This research project is allowing me to explore how to use AI tools in the research process and speed up time to insights. It is also giving me a chance to mix my research methods (qualitative and quantitative). Below are some of the artifacts I have created during the study.
Research Artifacts
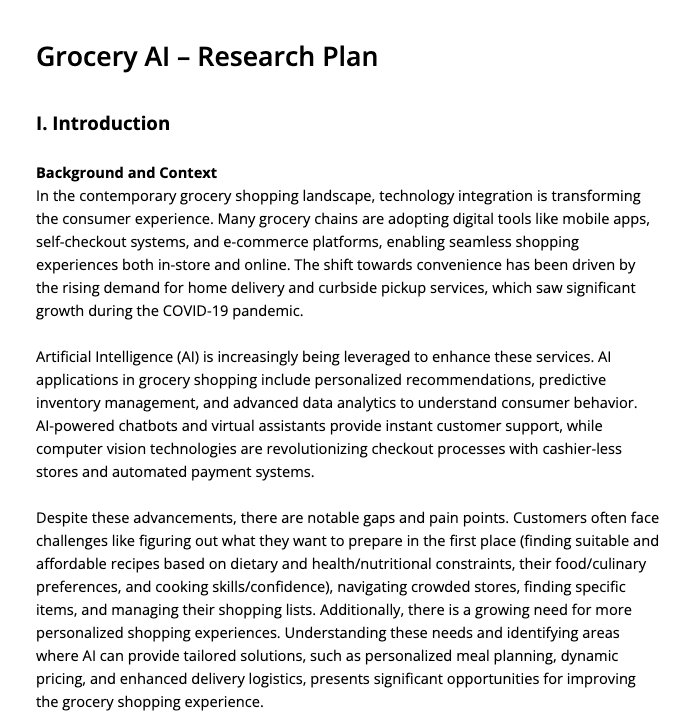
Research Plan
PROCESS
I began with a statement of context for the research study. I wrote down my objectives (see 4 gaps above) and worked with ChatGPT to iteratively to come up with a list of questions that I wanted to ask participants. I ran the prompt in ChatGPT several times and then curated the questions it gave me using my many years of user research experience. I then used the curated work between myself and ChatGPT to craft a complete research plan for the study.
OUTCOME
I edited it quite heavily, but ChatGPT was quite impressive at suggesting content for the research plan. Here is a link to the research plan we created.
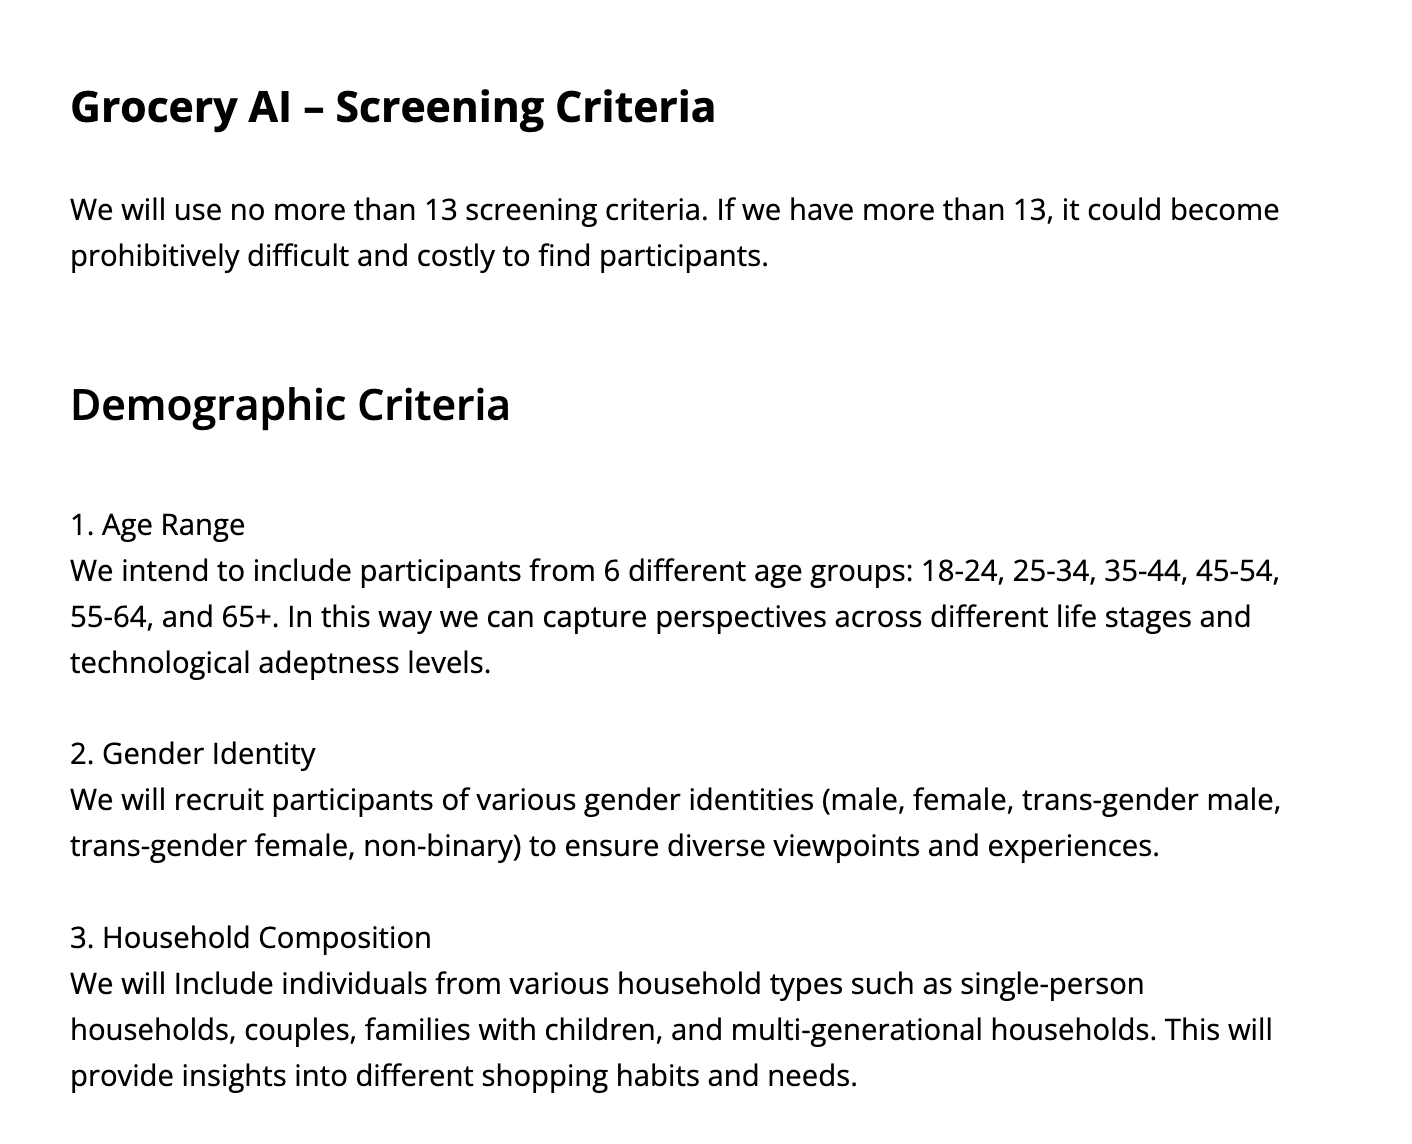
Screening Criteria
PROCESS
I asked ChatGPT to list the kind of criteria that I should include in the study. Afterwards I described what we were looking for in each criteria. Then I asked ChatGPT to rewrite the list of criteria that the two of us had created.
OUTCOME
We made a robust set of criteria. We covered all the important factors for participants in the research.
Here is a link to the screening criteria.
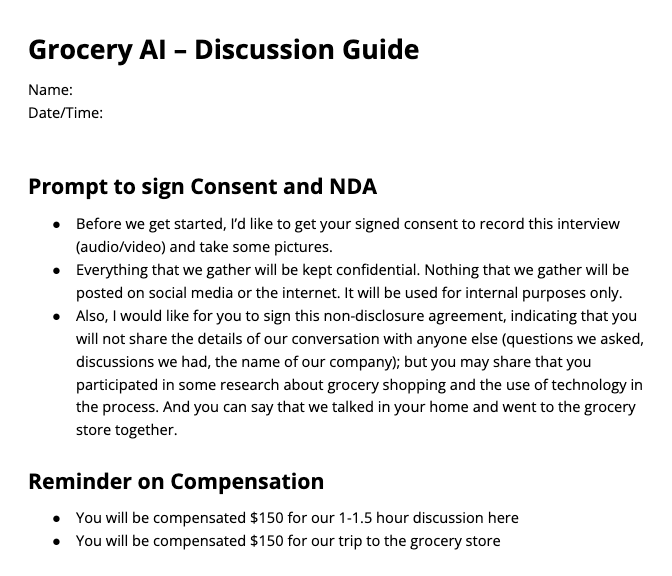
Discussion Guide
PROCESS
Worked with ChatGPT to iterate on questions to ask research participants. Added questions on my own and divided the questions into sections.
OUTCOME
Conducted 4 contextual inquiries with the discussion guide and used the data to begin synthesis into themes, insights, and ideas.
Here is a link to the discussion guide.
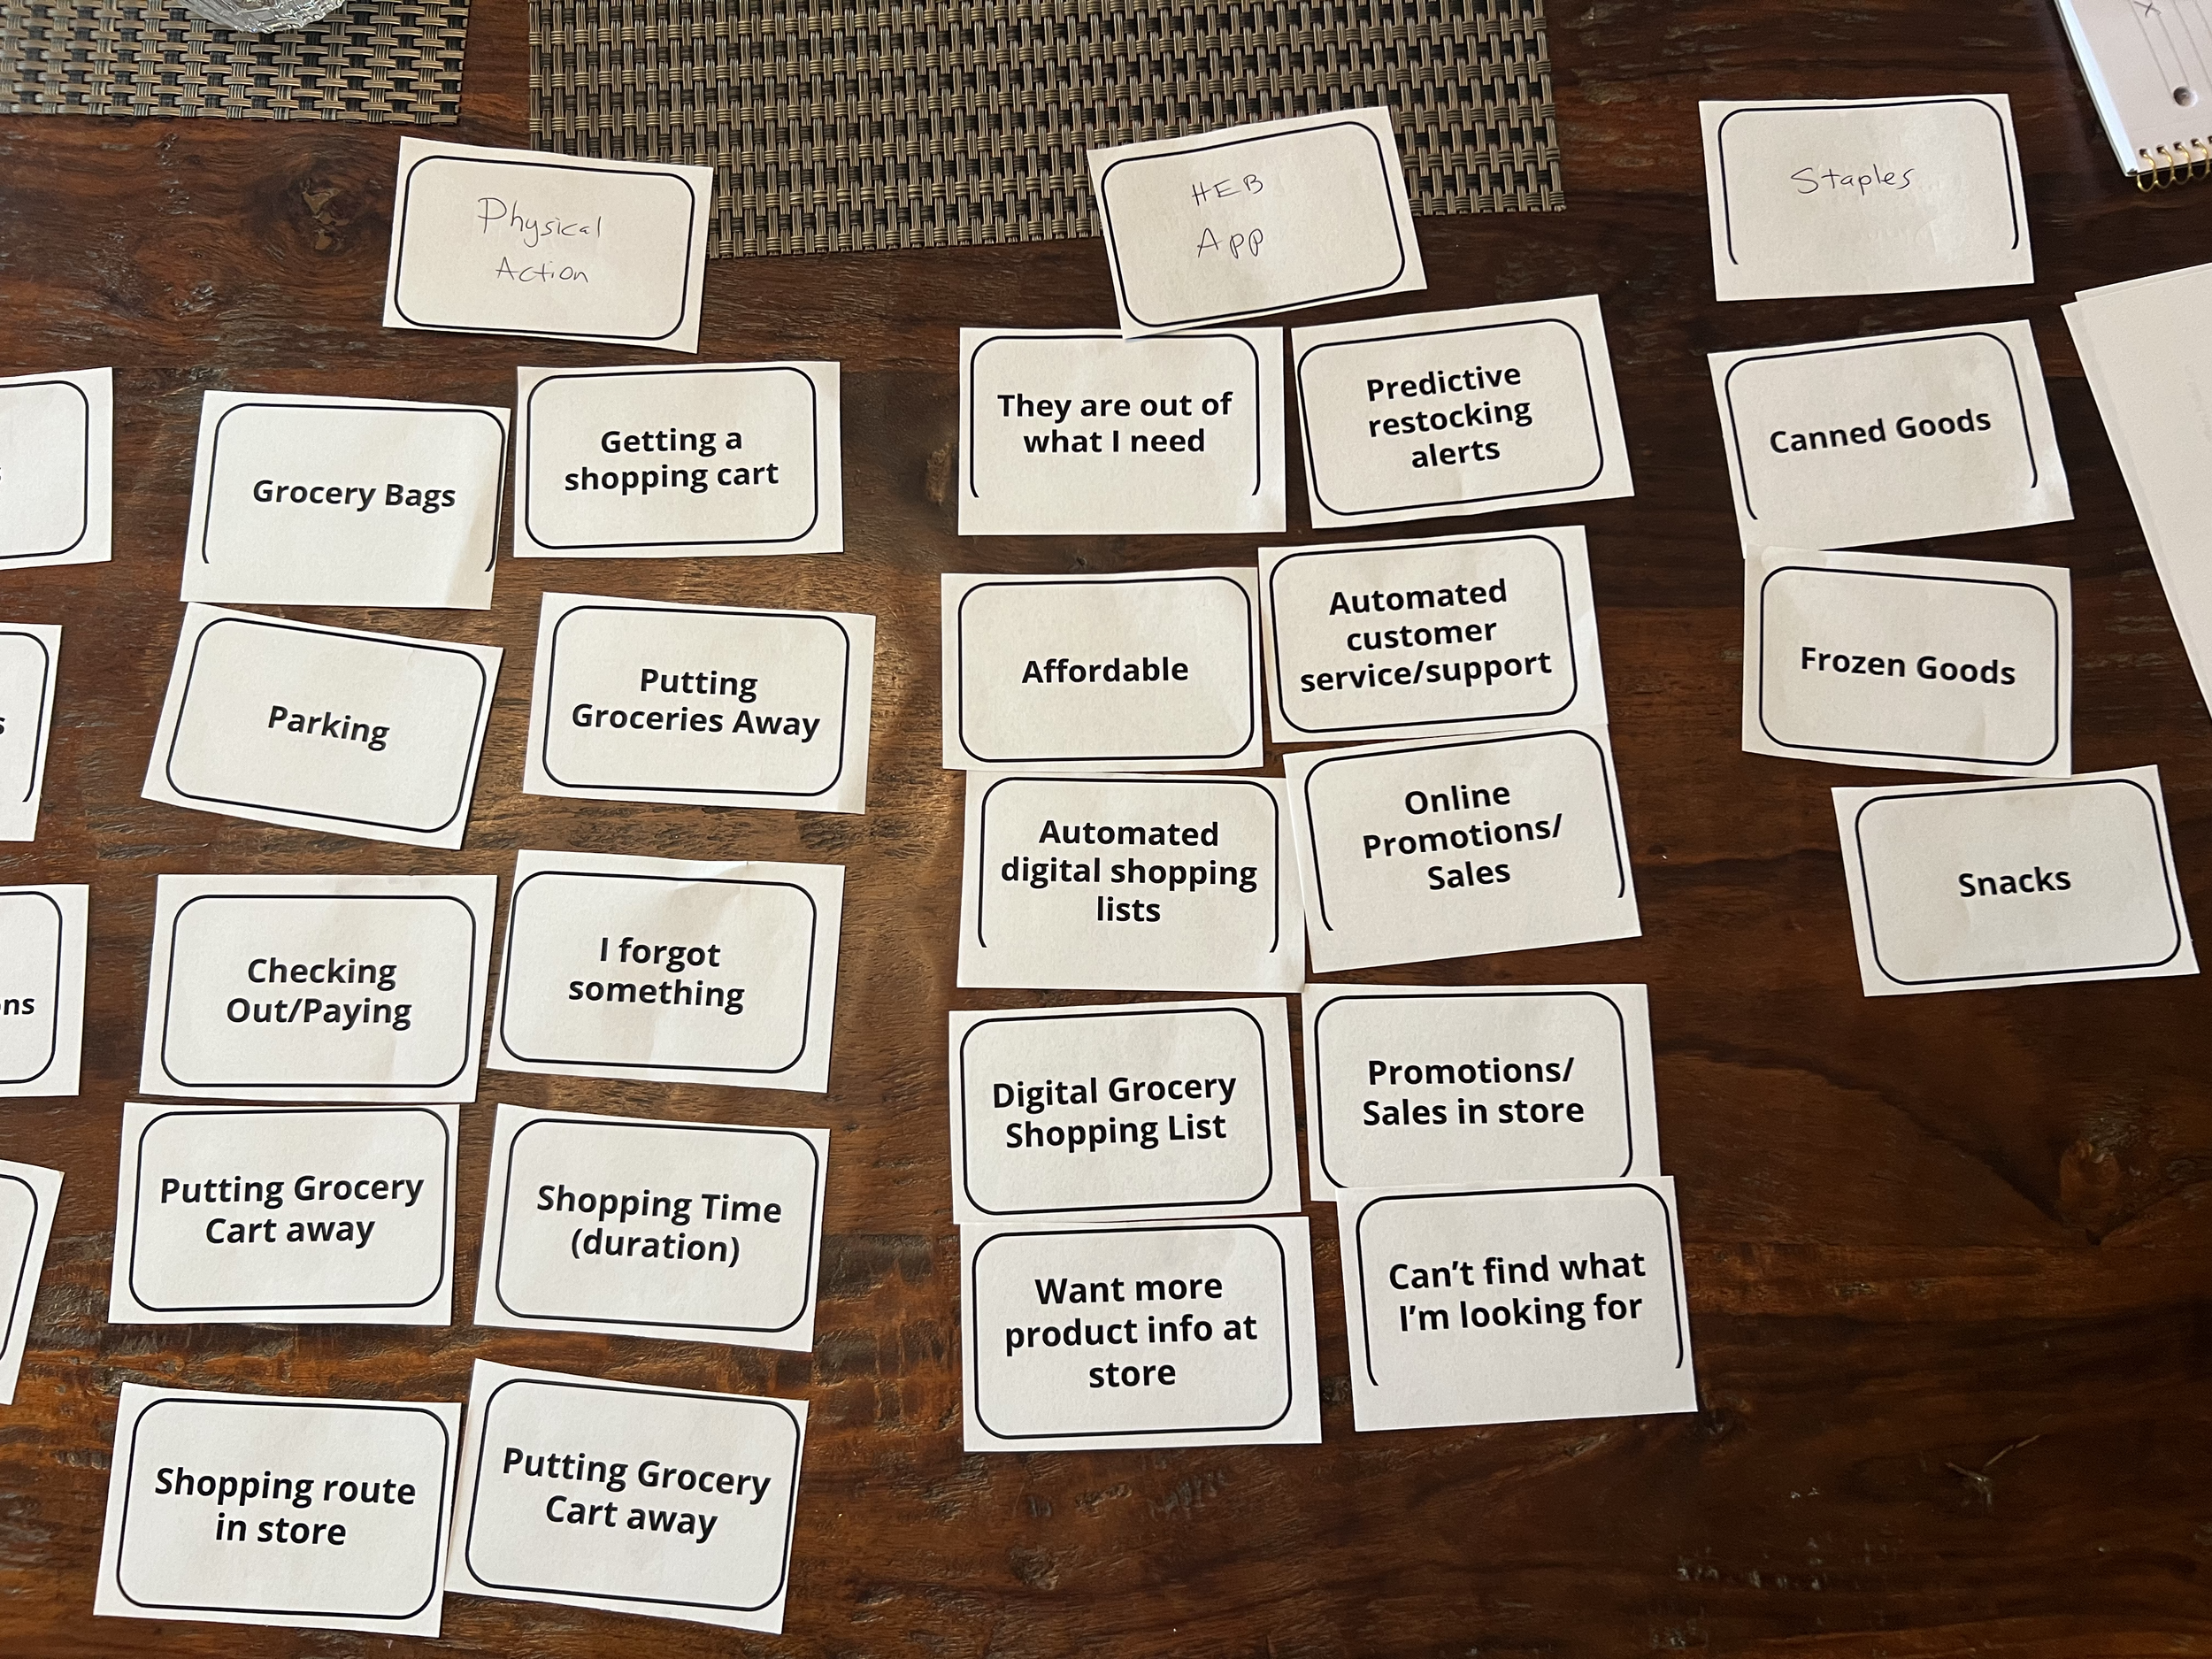
Card Sort
PROCESS
I presented interview participants with a deck of cards with labels of objects and topics from their grocery shopping journey. We talked through each of them and they organized them as they saw fit.
OUTCOME
Not only is it useful to see how people organize the cards (which helps you understand their mental model for the topic), but I also got a chance to rapid fire discuss topics related to the research study. Each card gave me a chance to dig a little deeper into why something mattered or didn’t matter to the participant.
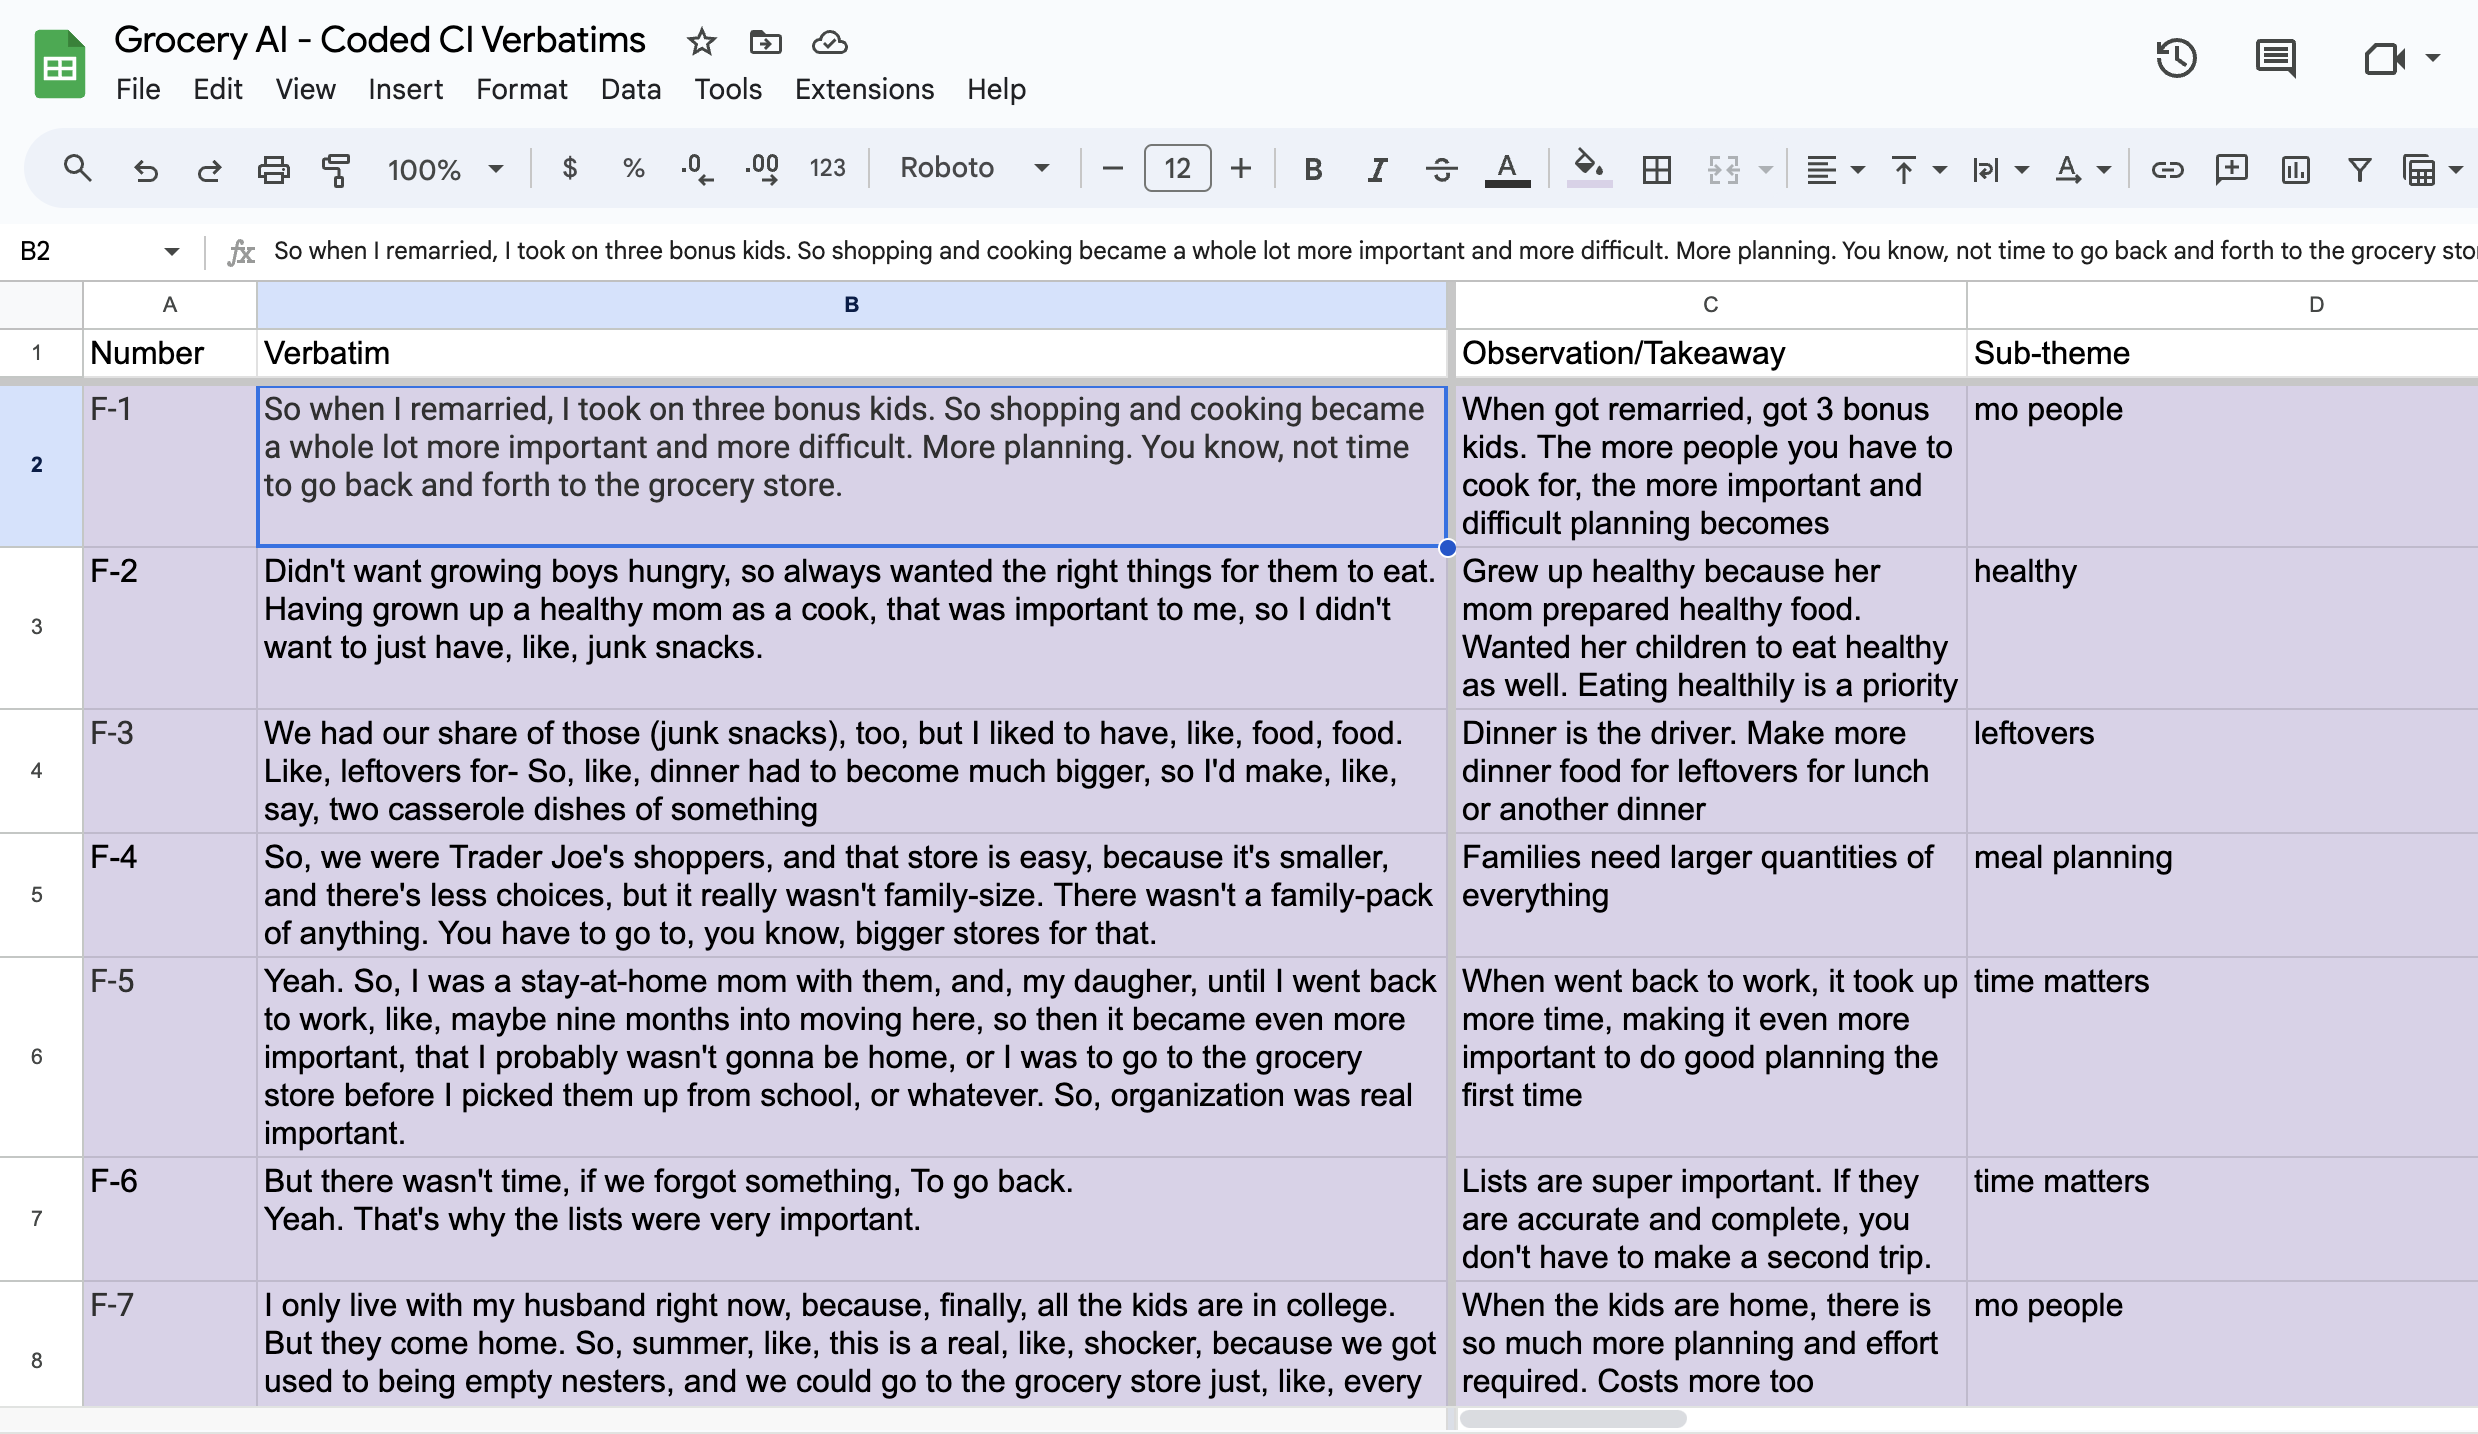
Coded Verbatims Spreadsheet
PROCESS
After using an online transcription service, I pulled out the most interesting verbatims (quotes from transcript) and created an observation/takeaway from those verbatims. Then I put those observations/takeaways into a figjam so that I could manually do affinity mapping.
OUTCOME
A thorough list of uniquely numbered verbatims and takeaways that I can use in conjunction with the affinity mapping figjam to find the original quote when I need it.
Note: the manual process of extracting and sorting the verbatims/takeaways is quite time consuming, as it has always been. That is why I’m also exploring AI text analysis tools such as Looppanel and Marvin to speed up the process.
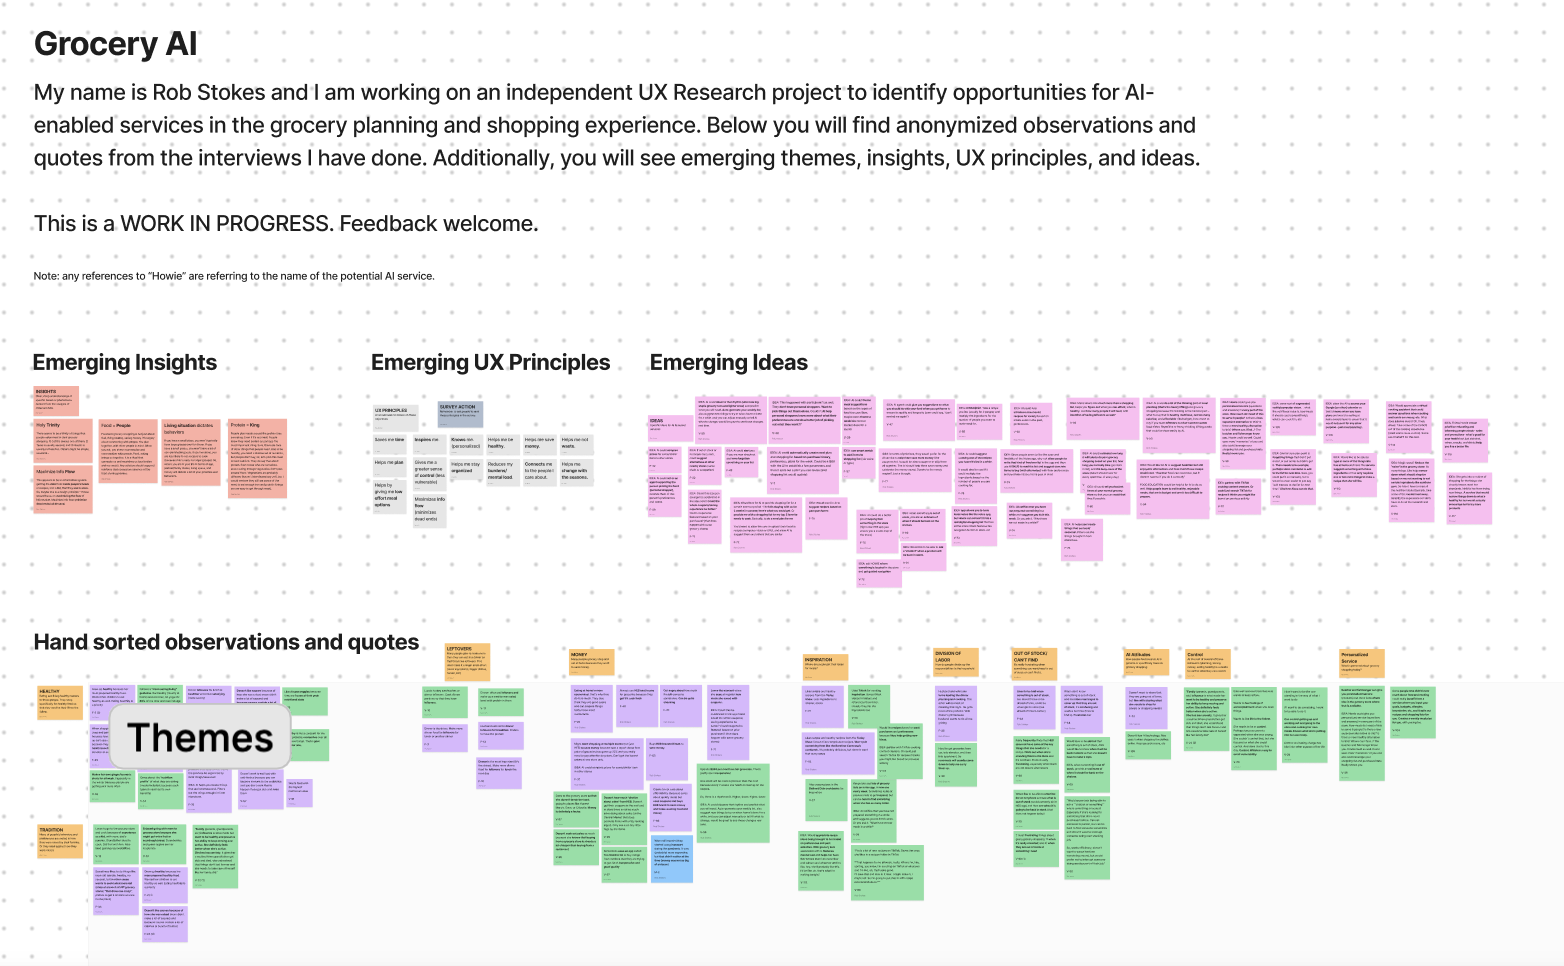
Affinity Mapping in Figjam
PROCESS
I took the observations/takeaways from the coded verbatims spreadsheet and created stickies for each of them in the figjam (color coded by participant). Then I started to clump the stickies together if they were about a similar topic. Along the way deeper insights started popping up with UX principles and ideas for how to potentially address user needs.
OUTCOME
Although the manual sorting process is time consuming (and I’m leaning towards AI text analysis software to speed up the process), I do not think the UX principles and ideas would have emerged as quickly with AI as they did with the manual sorting process. Going through the data manually has a way of “steeping” you in the content and helping your brain make those leaps.
Here is a link to the figjam.
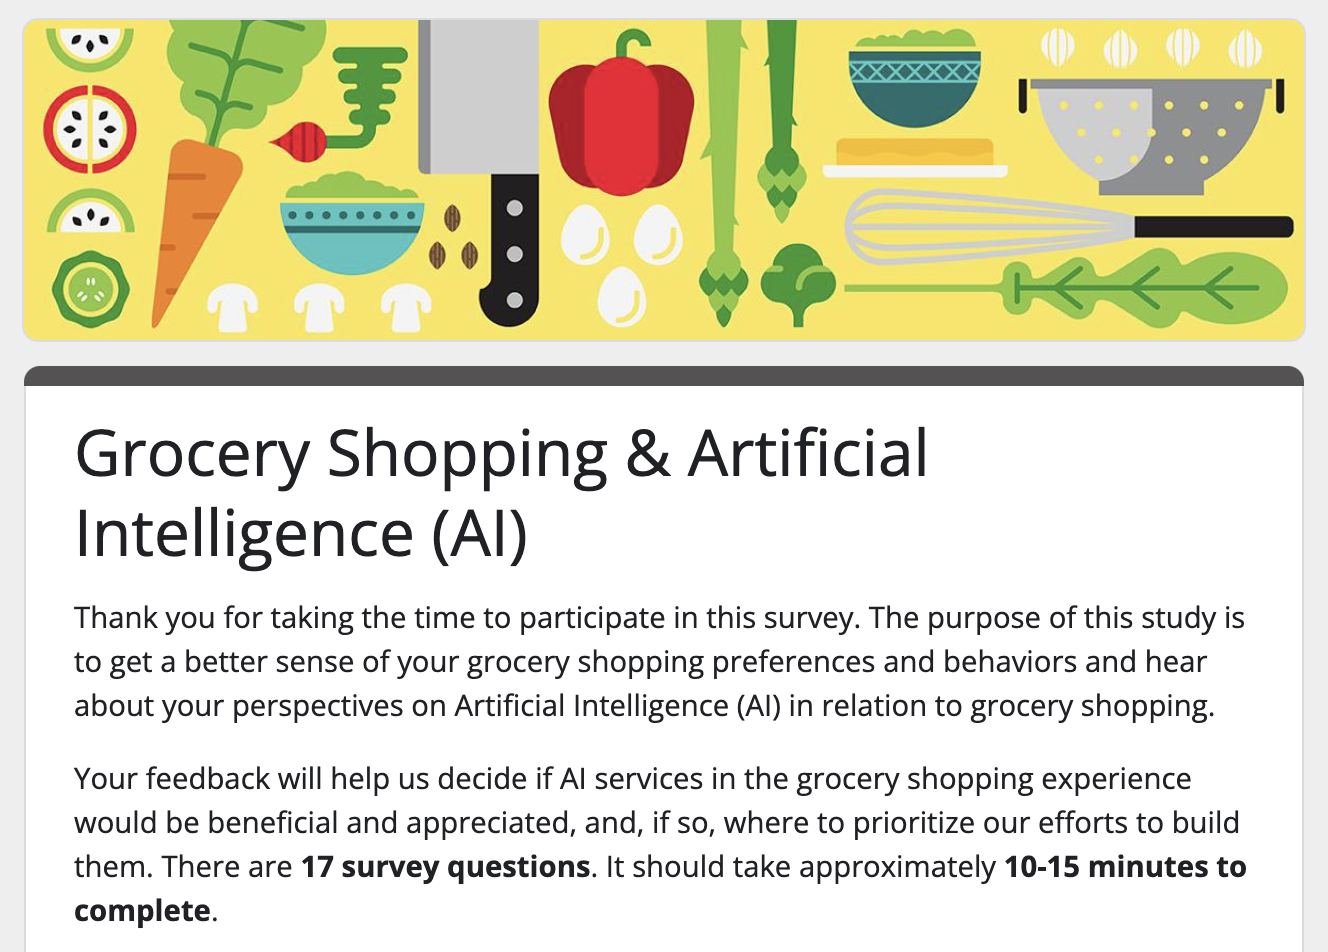
Quantitative Survey in Google Forms
PROCESS
I took a couple of questions directly from the contextual inquiry discussion guide and then created a few questions based on the results of the manual affinity mapping in the figjam. I placed all the questions in a Google Form and shared it with people in my network.
OUTCOME
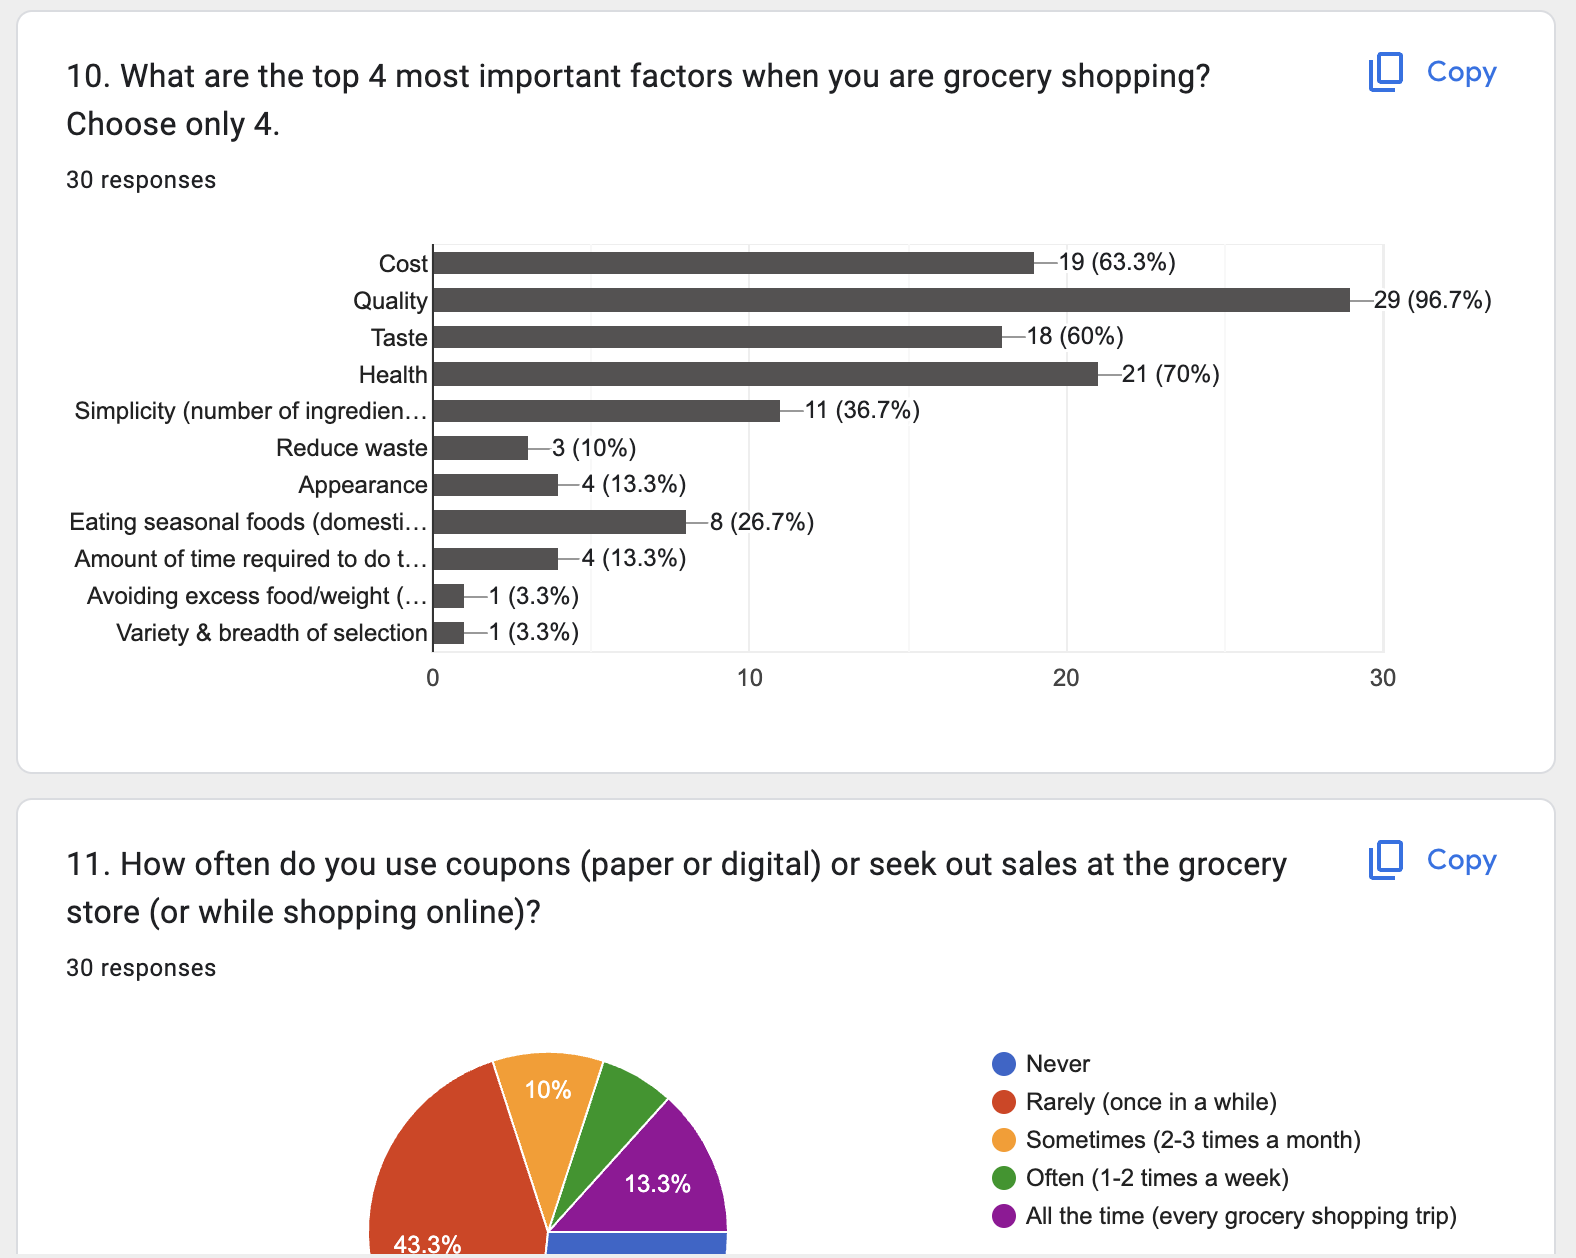
In a matter of days I had about 30 survey responses. While not statistically significant, the data was enough to counterbalance some of the insights/ideas I was getting from the contextual inquiry data. For example, based on the contextual inquiries, I was starting to think that people’s grocery shopping values were focused primarily around cost, health, taste, and quality. The survey data confirmed this; quality turned out to be number one, followed closely by health, cost, and taste.
On the other hand, I was thinking that everyone might using coupons regularly like most of my contextual inquiry participants, but the survey data demonstrated that 70% of the respondents never or seldom used coupons.
Quantitative Survey Results
PROCESS
Google Forms may not be the most robust survey platform, but it sure makes it easy to create one and basic summaries of the results are created automatically (which is very convenient). I intend to do some descriptive statistical analysis of the data, but that will come later.
OUTCOME
Several interesting insights have come out of the survey.
76% of participants indicated that they only eat out 1-3 times a week or never (fewer than I had anticipated)
43% of participants shop only 1 time per week and 50% shop 2-3 times a week
The distribution of what days people shop is very even across the week. There is no day that clearly stands out above the rest (although Monday is slightly above all the others)
67% of participants shop in store, despite the availability of curbside pickup and delivery options
80% of people shop for and prepare meals that are larger than they need so that they can have leftovers (50% 1-2 times a week, 30% 3-5 times a week)
Quality, health, cost, and taste are the most important factors when people are grocery shopping